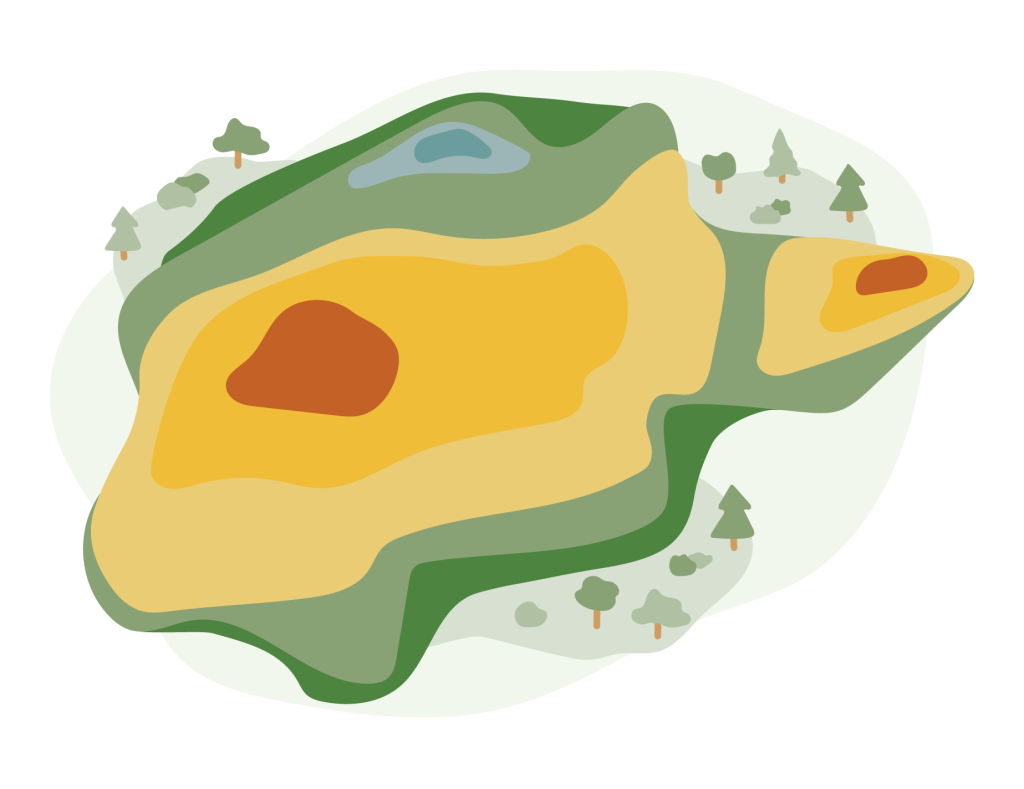
#16 – Example: Find variations in yield using yield maps from several years
In this example, we look into how several years of yield maps can be used to gain new insights into the performance of the field and how the yield is varying over the years. AgriOpt’s AI-powered digital assistant Freja is used for the analysis. The example can be seen as a motivation and inspiration for you to start collecting yield data!
#16 – Example: Find variations in yield using yield maps from several years Read More »