Some commonly used indices for measuring crop biosmass
Different vegetation indices can be used to process data from multi-spectral images from satellites or drones to valuable information on crop status and health. In this Agtech Letter, we introduce three indices that are related to the biomass of the crop, and can be used to estimate how healthy and dense the crop in a field is.
What is it that we measure in reality?
Depending on what you want to know about your crop, different vegetation indices can be create using the data from the multi-spectral image (as discussed in the previous Agtech Letter), but what is it that we measure in reality and can we trust the results?
One thing that you need to keep in mind when working with vegetation indices is that they often do not measure exactly the thing we are interested in and hence there is a certain degree of uncertainty in how to use and interpret the results provided by the vegetation index. An illustrative example is to use a vegetation index for determining how much nitrogen fertilization a crop needs. What can be measured using the vegetation index is often a so called proxy to the crop’s need for nitrogen. Some such proxies could be for example the amount of chlorophyll in the plant leaves, or how green and lush the crop is, which are related to the crop’s nitrogen uptake. In practice, there is a chain of relationships between different parameters between the thing we want to measure and the data that we have collected. Using the nitrogen fertilization example once again, the nitrogen need is related to the nitrogen uptake, which is related to the amount of chlorophyll in the leaves, that are affecting how reflected sunlight in different spectral bands look like, that can be used to create a vegetation index and a map of in-field variations.
As you can see, there is not a one-to-one relation between what we want to measure and what we can measure. Different vegetation indices vary in how strong the relations are (or how large correlation they have in technical terms), and there is lots of results in scientific papers and other publications on how well different vegetation indices are relating to the thing we want to measure. As long as you keep in mind that the vegetation indices are proxies for something we want to measure, and that they are not the ground truth, they are a powerful tool for analyzing and understanding your fields and crops.
The workhorse of vegetation indices in agriculture
Let’s first look at the arguably most commonly used and well-known vegetation index for analyzing crops and other types of vegetation. It has been during the last 50 years or so to analyze vegetation using satellite data.
Normalized Difference Vegetation Index (NDVI)
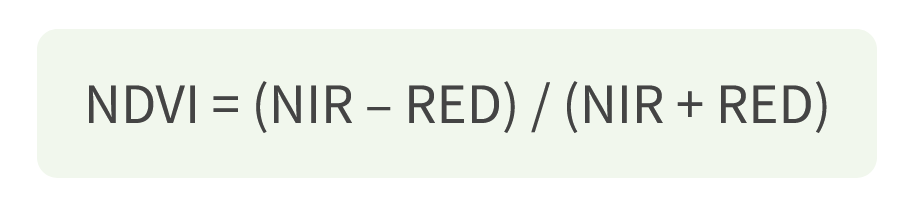
The NDVI index is probably the most well-known vegetation index used in crop farming. An intuitive explanation of NDVI is that it’s a measurement of how lush, or dense, a crop is and can be used as a proxy for how healthy the crop is. The main idea for this explanation is that healthy green crop absorbs much of the visible light that is used in the photo synthesis, while much light in the near infrared (NIR) spectra is reflected back from the leaf surface. By combining measurements of the reflectance of light in these spectra, the NDVI index can be computed as
NDVI = (NIR – RED) / (NIR + RED)
The NDVI values is always in the range -1 to 1, where a NDVI index of -1 corresponds to a water surface or a covering cloud. If the NDVI index is around 0 then it is often interpreted as rock, soil, or stones that are visible. From a crop farming perspective, NDVI values of 0.2-0.3 and up are most interesting since they often corresponds to vegetation (that is, crops when measuring on you field). By remembering the figure in Agtech Letter #18 we can get an intuitive understanding of the index. When the reflectance of NIR light is large and the reflectance of red light is low, then the NDVI index will get a high value close to 1, whereas the NDVI index will be close to 0 if the reflectance of red and NIR light are approximately the same. Hence, a larger value of NDVI indicates a more healthy, green, and dence crop in the field.
How to use the NDVI index, and what to keep in mind
The NDVI index can be used to find in-field variations of crop denseness and health than can be difficult to spot using eyesight. One the variations have been found using a map of NDVI indices of the field, the reason for the variation can be investigated using field visits, other measurements, and previous farmer experiences. A common way of using the NDVI map is to decide to fertilize areas that are thinner to improve the yield potential in these areas. However, this might not be the correct conclusion from the NDVI map since we don’t know what factor is holding the crop back in these parts of the field. It could be nitrogen deficits, but it could also be water stress, diseases, or damages from grazing wild life. Similarly, a part of the field with high NDVI values could be a dense and healthy crop, but also a thick and difficult weed. Hence, always visit the field to determine what causes the variations and determine a suitable action following after grounding your data with how the reality looks like.
Take visible soil into consideration early in the season
A drawback that hits the NDVI index is that it is difficult to measure crop properties if the soil is visible at the same time, or if it is a low chlorophyll content in the crop. To cope with this, the MSAVI was developed.
Modified Soil Adjusted Vegetation Index (MSAVI)
The MSAVI index was developed to measure crop properties when the crop is not covering the soil properly, and the index has accounted for effects from the bare soil in the reflectance of different types of light. Similarly to NDVI, the MSAVI index is used to measure and estimate the lushness and health of the crop, but it is more robust in the case where the soil is clearly visible before the crop has full coverage of the ground. The MSAVI index is defined and computed similar to the NDVI index, but using an additional term as
MSAVI = (NIR – RED) / (NIR + RED + L)*(1+L)
As can be seen, the difference between the NDVI and MSAVI indices are the “L” in the equations. This “L” parameter is where the effects from the soil comes into play, and how to compute the value of “L” is not interesting here but we simply note that it can be done easily and that it is used to account for the effects of soil in the measurements. The MSAVI value is always between -1 and 1, where everything below 0.2 usually is considered soil, 0.2 to 0.4 corresponds to emerging crops, and 0.4 to 0.6 corresponds to the leaf development stage. Once the MSAVI value is 0.6 and above, it starts to saturate and is not as sensitive to variations in the crop. At this point in time it could be smart to switch to the NDVI index instead, since the soil is probably not visible anymore.
How to use the MSAVI index, and what to keep in mind
The MSAVI index can be a good tool to use during the early season to measure variations in emerging crop. Examples of use-cases are to find areas that haven’t survived the winter well and need to be seeded again, and to monitor the early crop emergence to plan your management of the crop. As for the NDVI index, you need to visit the field and check the spots with bad emergence or very thin crop since the reason for the under-performing crop cannot be known from the vegetation index alone. Hence, find the areas with low and high MSAVI values, and visit the plots to better understand what has happened and if you need to do anything to fix it.
Measure variations later in the season
Both the NDVI and MSAVI indices become saturated when the crop becomes dense, which makes it difficult to measure and determine in-field variations for a dense crop using these. Instead, the NDRE index can be used.
Normalized Difference Red Edge Index (NDRE)
The NDRE index is using reflectance measurement for light in the red edge spectra and the NIR specta, and is particularly good at measure chlorophyll content in a crop with a dense canopy, typically during the late season. Since the NDRE index is not saturating as much as NDVI and MSAVI, and the chlorophyll content can be related to the crop health and nitrogen uptake, the NDRE index can be used to measure variations in the crop health and denseness even after the NDVI and MSAVI indices have saturated. The NDRE index is computed as
NDRE = (NIR – RED EDGE)/(NIR + RED EDGE)
This is the exact same equation as for NDVI, but there the reflectance of light in the red-edge spectra is used instead of reflectance in the red spectra. The NDRE values is always between -1 and 1, where everything below 0.2 is considered soil or establishing crops. Values between 0.2 and 0.6 indicate a crop early in the season or a stressed crop. NDRE values above 0.6 indicates a healthy and lush crop, and some researchers mean that values above 0.8 can indicate an over-fertilized crop.
How to use NDRE and what to keep in mind
The NDRE index is a good alternative to investigate variations in the crop health and stresses during the late season when the NDVI and MSAVI indices have (partly) saturated and is close to 1 across the field. As for all remote sensing techniques, visit the field to determine why the NDRE index is showing a low or high value at certain parts of the field. Is it water stress, nutrient deficiency, a disease, or something else?
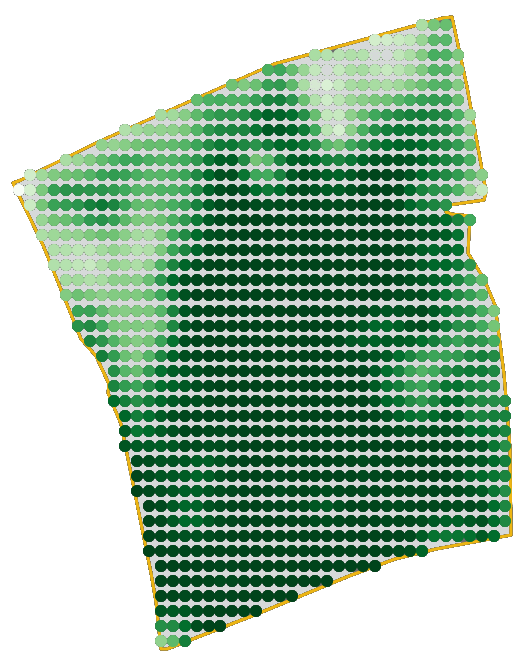
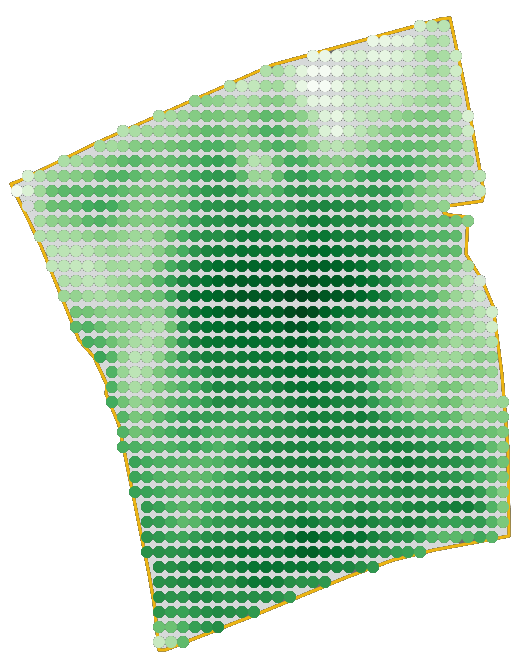
Example of differences between MSAVI and NDVI
To show you how the MSAVI and NDVI indices can differ, consider the two maps created from a satellite image captured in mid-April. Lighter-shaded green areas corresponds to a smaller value of the index, and darker-shaded green areas corresponds to parts of the field where the index have a higher value. From the maps, we can determine that parts of the field (center-to-south) the MSAVI index has started to saturate at values close to 1 (that is, dark green) and is not visualizing the variations in a good way. The NDVI on the other hand does not seem to have saturated yet and is probably a good measure of the in-field variations at this time during the season.
Agtechers' Actions
Learn how to use the most common vegetation indices to better understand how, where and when they should be used. Start using them as a tool to find interesting parts of the field that need your attention to make the correct management decisions.
In the next Agtech Letter we will look at two indices that are related to the crop moisture content and the water content in the soil.