Vegetation indices for crop monitoring
Vegetation indices computed from camera images captured by satellites or drones can be used to estimate the crop status for a field. In this Agtech Letter we walk you through the basics about vegetation indices – what they are and how to compute them. In the next couple of Agtech Letters we will look at specific indices.
Vad is a satellite or drone image?
When we talk about satellite images, or drone images, for far-field sensing we simply mean an image that has been captured by multi-spectral camera mounted on a satellite or a drone. In the case of satellites, the camera is an extremely high-quality and expensive sensor whereas for drones cheaper cameras can be used. The camera sensor basically consists of a large amount of pixels that are placed in a quadratic grid, and for each pixel the camera will measure the amount of light of a specific type that hits the pixel (red, blue, infrared, etc). These measurements are stored in an image file format, and each pixel in the image contains information about how much light was collected by a certain pixel in the camera sensor.
If the position of the satellite or drone, and know the orientation of the camera, then we also know what part of the surface of the Earth that was captured in the image. Hence, each pixel in the image can be related to a corresponding geographical area on the ground. This means that when you look at a satellite image of your field, you are simply looking at a camera image from a satellite where each pixel in the image have been matched to a certain part of you field. For the commonly used Sentinel 2 satellite, each pixel in the image covers 10 x 10 meters on the ground. Remember that we say that the image has a spatial resolution of 10 x 10 meters.
Multi-spectral cameras and different types of light
Physics have taught us that all light is an electromagnetic radiation with a given wavelength, and the wavelength determines what type of light it is and what properties it has. Without getting too deep into physics, we can divide the full electromagnetic spectrum into different intervals of wavelengths, och spectra, where some of the most well-known spectra are X-rays, ultra-violet light, infrared light, visible light, microwaves, and radio waves. The use-cases and properties of the different spectra are varying a lot, although the only difference more or less is the wavelength of the electromagnetic radiation. Visible light are in the interval with wavelengths between approximately 380 – 750 nanometer (nm), where one nanometer is 1 billionth of a meter. That is, really short!
A multi spectral camera can measure light with different intervals of wavelengths, so called spectral bands. The exact spectral bands that are measured is dependent on the sensor and its specification, but common spectral bands used in agriculture are blue, green, red, red edge, near infrared (NIR), and short wave infrared (SWIR). These are all measured by for example the Sentinel 2 satellites and can be used to create different vegetation indices.
Each pixel in the satellite or drone image, that has been related to a specific part of the Earth’s surface, hence describes how much of the light in a certain spectral band that has been reflected off that part of the ground. By capturing several images after each other and then stitch them together with smart algorithms, it is possible to create satellite images that covers a large area such as a country or high-resolution drone images that covers a complete field or farm.
A camera that measures about 3-15 spectral bands is usually called a multi-spectral camera, whereas a camera that measures even more spectral bands is called a hyper-spectral camera. A regular camera such as the one in your smartphone usually measures three spectral bands, namely red, green, and blue (RGB).
What is a vegetation index?
A vegetation index can simply be considered a tool for creating useful information from all that data which is captured by the multi-spectral camera, where the index is adjusted and tailored to the specific task. There is lots of research going on to find good vegetation indices for measuring different properties, and they are all more or less operating using the same straightforward principle: namely to compute a relation between the reflectance of different spectral bands. When the light from the sun, or some other light source, shines on any material a part of the light will be absorbed and the rest will be reflected. By measuring the reflectance of different types of lights, or spectral bands, using a multi-spectral camera we can obtain a lot of useful data.
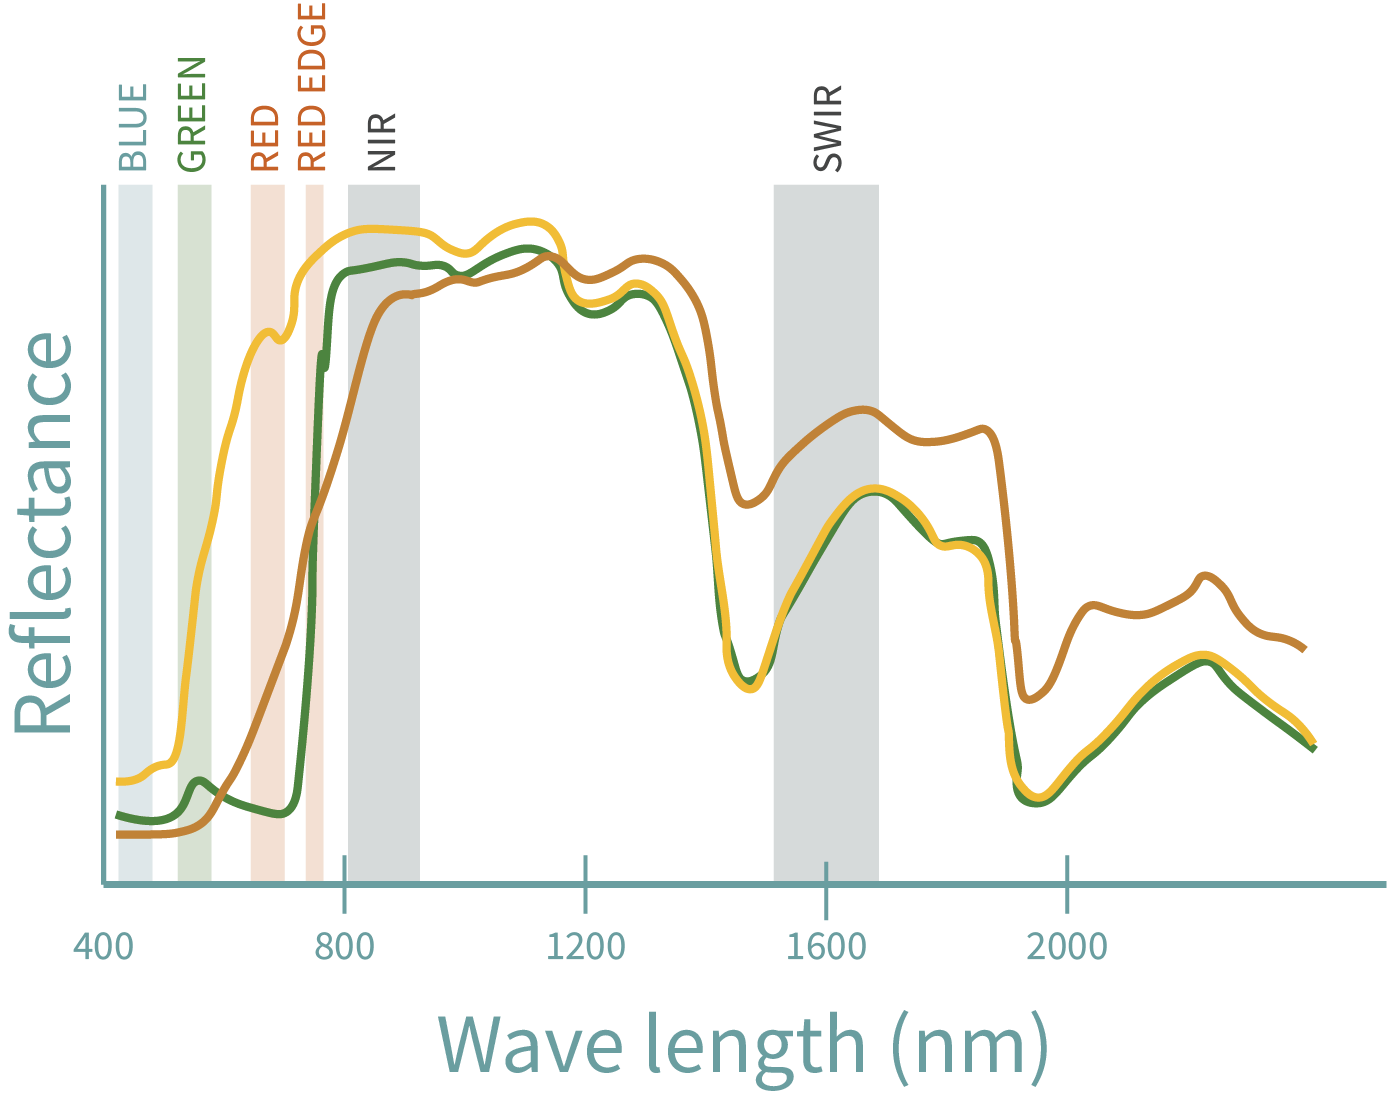
In the image below, we provide an example of how the reflection of light with different wavelengths might look like for a healthy crop (green), a stressed crop (yellow), and a dry crop (brown). For each pixel in the multi-spectral image, these reflectance values are stored for each type of spectral band that the camera measures. A vegetation index is created by comparing how much light that has been reflected in the different spectral bands, and depending on what spectral bands you compare and how you compare then different properties of the crop and soil can be estimated. By computing the vegetation index for each pixel in the image, a map across the field can be created that show for example the biomass of the crop or the presence of water after snow meltings.
An intuitive understanding of vegetation indices
The figure above where the reflectance of different condition of a crop can be used to develop an intuition for what a vegetation index is and how it works. The figure is not an exact measurement, but an illustration that is made to show the typical behavior of the reflectance. Hence, the shape is roughly correct and works well to get an intuition.
For starters, if you compare the lines for a healthy crop (green) and a stressed crop (yellow), you can see yourself that the reflectance of NIR light is almost the same for the two lines whereas the reflectance of red light differs a lot. Hence, if you measure the reflectance of both red and NIR light, it should be possible to relate them in some way that makes it possible to determine if the captured light comes from the healthy crop (large reflectance of NIR light and small reflectance of red light) or if it comes from a stressed crop (large reflectance of both NIR and red light). In the same way, you can compare the healthy crop (green line) with the dry crop (brown line). In this case, the reflectance of NIR light is once again similar, but the reflectance of SWIR light differs quite much. Even for this case, its intuitive that we can in some way determine what kind of crop that the reflected light comes from. Note also, that the stressed and dry crops have different reflectance of SWIR light, which makes it possible to determine whether the crop is stressed by for example nutrient deficiency or if it is dry.
The theory and creation of the different vegetation indices of course require much more effort than this simple intuitive example, but they more or less follows this foundational idea of being able to measure different types of crop conditions by finding spectral bands that can be compared in a good way. We will walk you through some of the most commonly used vegetation indices for crop monitoring in the coming twp Agtech Letters.
Agtechers' Actions
Study the figure with different reflectance of different lights and different crop conditions and build your intuition about the spectral bands. This intuition will help you a lot to understand the vegetation indices and what they can and can’t do for you.
In the next Agtech Letter we will dive into three vegetation indices for measuring crop biomass and crop health in different ways.