
Data related to the crop yield
Data that describe the yield from a field is important information when planning and analyzing the crop season, the actions and the inputs that are used to grow the crop. It is also a valuable source of information to better understand the field and its growing conditions, drainage status, and under-performing areas.
How to collect data about the crop yield
The simplest type of yield data is to measure the total amount of yield that a crop produces for a field, like summing the number of wagons of harvested wheat or the total weight of grain that has been dried from that particular field. This can be done using either digital or analog logs. By dividing the total number with the size of the field, you get the average yield per hectare, which can be used for planning and analysis purposes. Collecting and storing the total yield for a field is better than doing nothing of course, but the problem with this type of data is that it has a very low spatial resolution with only of data point per field (that is, the total yield). To achieve a better understanding of the field’s performance, it is preferred to increase the resolution and collect more yield levels at individual parts of the field.
This is exactly what GPS positioned yield logging equipment can help you with. During the last 20-30 years it has been possible to create so called yield maps using a combine harvester that is equipment with a GPS sensor for positioning together with a yield level sensor. Today this technology is much more commonly available than 20 years ago, but still there are many who don’t collect the yield maps even if they have the equipment for it. In essence, the combine harvester measures the wet yield and moisture content during harvest and by tagging each measurement to a GPS position, a map of wet yield and water content can be created. The technical details on this topic will be covered in later Agtech Letters or Agtech Deep Dives but here we provide an example of how the maps are created and used.
Data about the yield is important for analysis
The crop yield levels produced and harvested from a field is dependent on many different factors and it is often difficult to relate a single input or action to a specific contribution to the total crop yield. However, even if it is difficult to relate for example a single fertilization to the effects on yield, it is still extremely important to measure the harvested yield in some way since it gives us the answer to what the yield actually was on that particular field and season. Even if only the total yield is collected, it will be useful for analyzing the economics for that field (that is field profits = field revenues – field costs), but can also be used to plan and determine different actions and inputs in the future since it becomes easier to determine whether in action is economically reasonable to do. If you collect yield maps that show in-field variations of yield, you could even create a profitability map of the field showing you the parts of the field that are contributing to profits and losses.
Example of a yield map from a rye harvest
To better describe the process of collecting and using yield maps, let’s consider a rye harvest in Sweden that was harvested using a GPS-equipment combine harvester that measure wet yield and moisture content. We will show the processed maps for wet yield, moisture content, and dry yield that has been produced using the raw data from the combine. The wet weight is the actual measured weight of the crop at harvest when it has a certain moisture content that is also measured here. The dry weight is the weight of the crop when it has been normalized to 14% moisture content, which is a common value to normalize cereal yields to for comparison reasons.
The raw data (that is, the data directly from the yield sensor in the combine) is pretty “rough” and needs several steps of processing to become useful. One example of data that needs to be processed is that the headlands are measured every time the combine turns, but it is only harvested one single time. Hence, all other times the headlands will be logged with zero yield which must of course be removed in a smart way. Another example is when the full cut width is not used, meaning that the measured yield will be lower than what is correct one. This is a consequence of how the yield sensor operates, since it uses the measured weight, speed, and cut width to determine the yield per hectare. Other problems include driving speeds and if the combine is moving up- or downhill, since these are affecting the yield sensor (depending on what type of sensor it is). The details of yield mapping will be presented in an Agtech Deep Dive, but here we are satisfied with noting that many of these problems can be solved using a good pre-processing of the data before using it to produce a yield map that high-lights relevant variations in the field.
Calibration of the yield sensor
One important thing that many skip is the calibration of the yield sensor, which is necessary for most models of sensors in order to measure the correct weight. Different models need to calibrated at different intervals, and more modern sensors usually need less calibration than older ones. However, even without a proper calibration, the in-field variation of the yield can be measured reliably but always keep in mind that the exact level of the yield at different parts might be incorrect if the sensor is not calibrated properly.
If you measure the total weight of the yield from a field using for example scales before unloading into the silo or drier, then it is possible to do a post-harvest calibration of the yield maps using a software that provide this functionality. Ask your service provider if they have this feature, and use it if they do!
Moisture content transform wet yield to dry yield
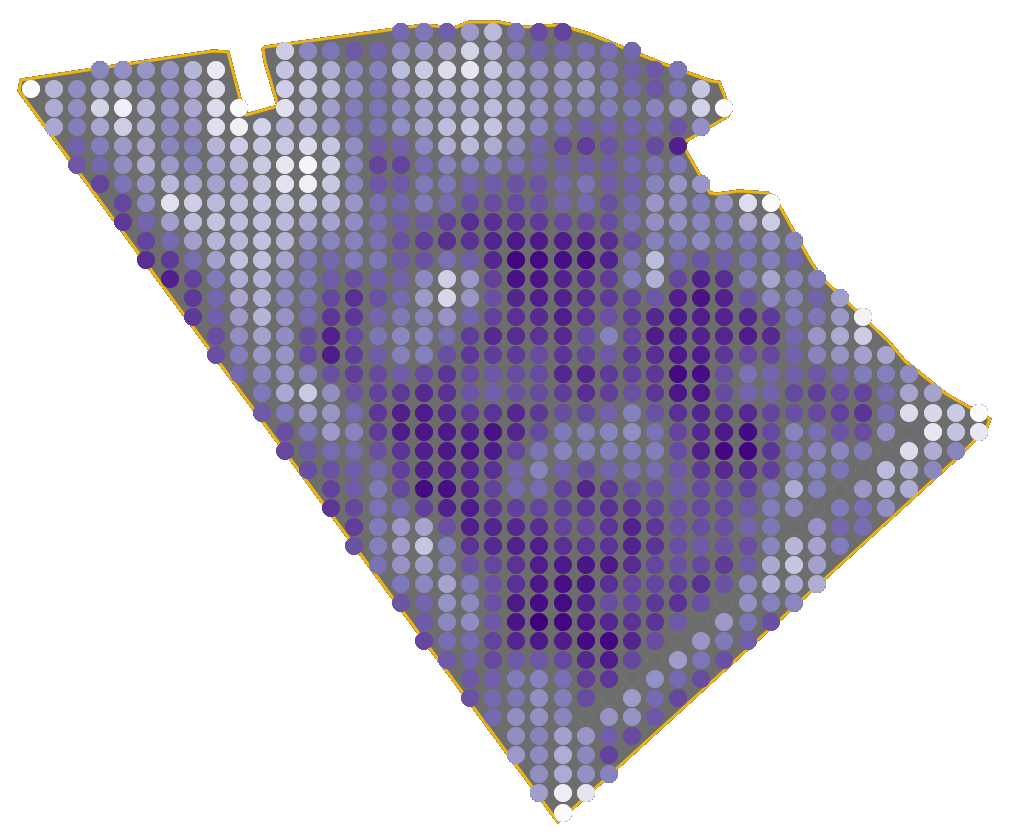
In the following images, yield maps where the raw data has been processed to remove the worst roughness are shown. In this image, the wet yield measured in the combine harvester is shown, and we can see that there is a large area in the middle with a high-yielding crop (dark-shaded purple), but also the more lower-yielding areas (light-shaded purple) at the headlands and the northwest part of the field. This crop yield have different moisture content and cannot directly be used for analysis of crop production performance of different parts of the field, since it need to be normalized to the same moisture content first.
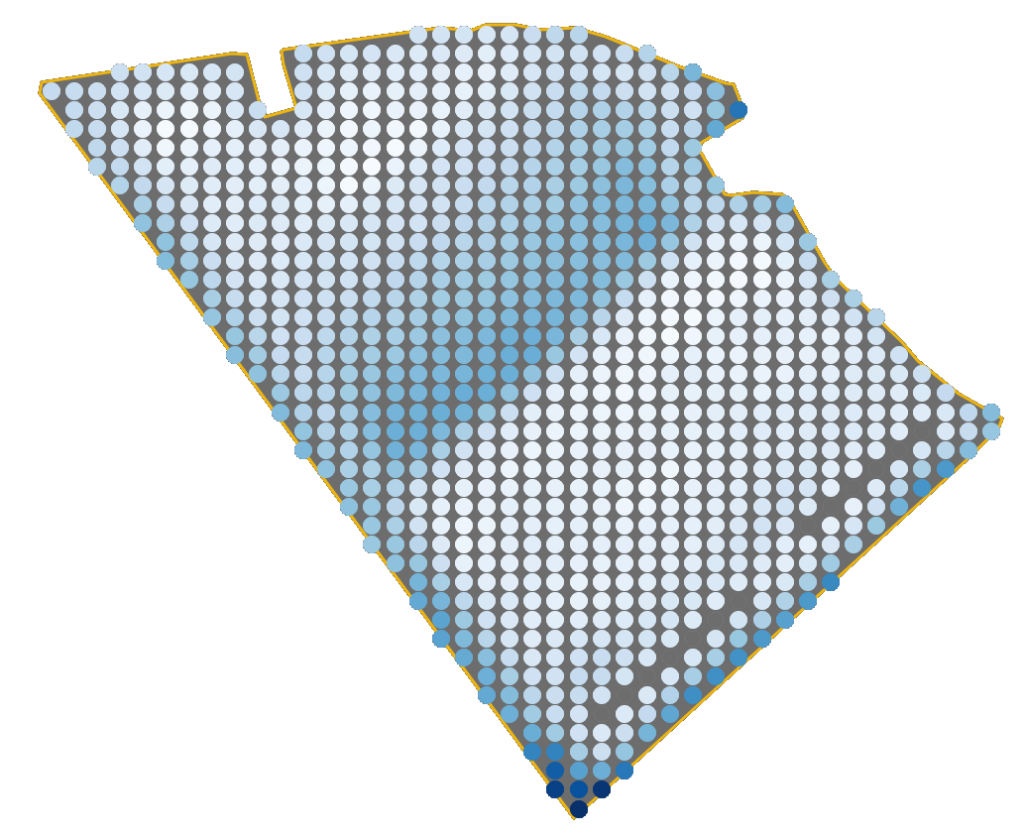
This combine harvester has measured the moisture content of the crop as well, and this information can be used to normalize the wet yield, but also to find areas of the field that might be more wet from year to year which could indicate areas that should be harvested a bit later for allowing it to dry. The moisture content map ranges from approximately 14% (light-shaded blue) to 18 % (darker-shaded blue). The sharp line in the middle of the field could be a consequence of harvesting at different dates or during different times of the day, where the crop has been allowed to dry for a bit longer. Or the other way around, that the wetter parts have been harvested after rainfall. Or for some other reason not known to us.
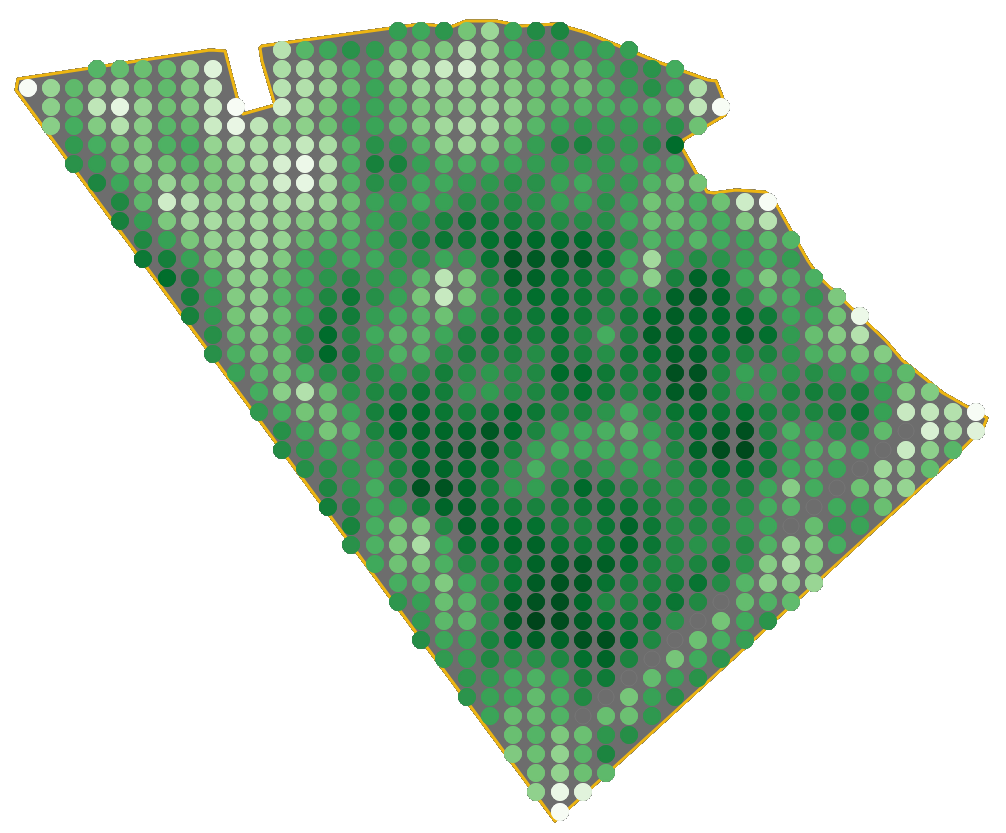
Using the wet weight and the moisture content, it is possible to compute the dry yield for each of the points in the yield map to show the field’s crop yields normalized to 14 % moisture content. By doing this normalization, it is easier to compare the values within the field to determine what are the high-yielding areas, but it is also easier to compare between different years and farms. Furthermore, the grain is often traded at a weight that is normalized to 14% moisture content and hence it is easier to use it for economic planning and analysis.
Other types of data about crop yield
There are other ways to measure data on crop yields, as for example crop protein content sensors in the combine that can create a protein content map across the field to show the variation in crop protein, similarly to a yield map. This type of sensor is not commonly used today, but given that the performance and costs are acceptable it should be a valuable tool for analyzing the effects of for example fertilization inputs. The combination of protein content and yield can be used to compute the nutrient efficient and how much of the applied nutrients that has been used by the crop at different parts of the field.
Being able to predict the yield levels already during the season is one of the holy grail of crop farming, since if that is known it is much easier to plan your resources in an optimal way. Even if we probably won’t be able to predict the future yield exactly (it’s difficult to predict the weather..), there is a lot of research and development spend on for example using satellite images during the season to predict the yield levels. For example, algorithms from machine learning can be used together with satellite images and other types of data collected at the right time to predict the yield levels, but this technology is not mature today. However, it seems to have a large potential to aid in guessing what the yield levels will be at different parts of the field and it is a technology that is worthwhile to keep an extra eye on and experiment with to see if it can be any help to you.
Agtechers' Actions
Yield data is a very important piece of the puzzle to understand, improve, and manage your crop farming operations. Even it can feel overwhelming and messy to get started with yield mapping using your combine, we strongly believe this is time and money well spent over time. After collecting let’s say 3-5 years of yield data you will start to see patterns in yield.
In the next Agtech Letter we will learn more about how yield maps can create value through smart analysis and insights.