Data related to the crop itself
Data that relates to the crop and its condition are very useful for planning and analyzing effects of different actions and inputs to the field. In this Agtech Letter we provide some common types of data that are available to you.
How to collect data about the crop
Data about the crop can be simple things like the type and variety, or the total amount of seed that has been used during seeding, but it can also be very detailed drone images of the growing crops to detect for example weeds in the field. Common practices for collecting crop data includes manual inputted data such as crop type and variety, but for other types of data it is more efficient to use sensor solutions and algorithms to measure, process, and store the data.
The sensors that are available today can be roughly be categorized into hand-held, machine-mounted, drone-based, and satellite-based sensors. In some cases, one type of sensor that is for example hand-held can also be machine-mounted or drone-based as well, while other sensors are only available in a single category. As an example, consider a regular camera (RGB-camera) and a sensor for measuring nutrient levels in the crop sap. The RGB camera can be of any of the categories listed above, whereas the sap-measuring sensor only exists as hand-held today. In future Agtech Letters and Agtech Deep Dives we will dig deeper into different sensor solutions and what data they collect. In this Agtech Letter we outline a few commonly used sensors and ways to measure information about crops.
Data related to the biomass of the crop
The biomass of a crop, or its lushness, across a field is interesting to keep track of to analyze how the crop growth is progressing. This information can be used to detect parts of the field that are not behaving as expected, to plan different actions and inputs, to do site-specific fertilization, and many other things.
There are different types of sensors available for measuring biomass but the most common types are based on a multi-spectral camera that can measure both visible light and infrared light. The spectral camera can be mounted on a drone that fly over the field, on a satellite that orbits Earth, or on a tractor or machine that is driving across the field. The underlying function of the different sensors are the same, but they come at different cost for the farmer and provide different resolution in time and space.
The underlying idea behind measuring biomass using different sensors are based on the fact that the chlorophyll in the crop absorbs red light while healthy leaves reflects most of the infrared light. Hence, by looking at the relation between the reflected red light and the reflected infrared light, it is possible to construct different vegetation indices. The vegetation index can be used to determine the biomass across the field. There are several vegetation indices available, but two common ones are the vegetation index-workhorse NDVI and the other is MSAVI. Both comes with different pros and cons, but we leave this discussion to a future Agtech Letter where we will dig deeper into vegetation indices. Note that the vegetation indices are an estimation of the biomass, and we cannot really determine what is a crop and what is for example weeds by simply looking at NDVI or MSAVI.
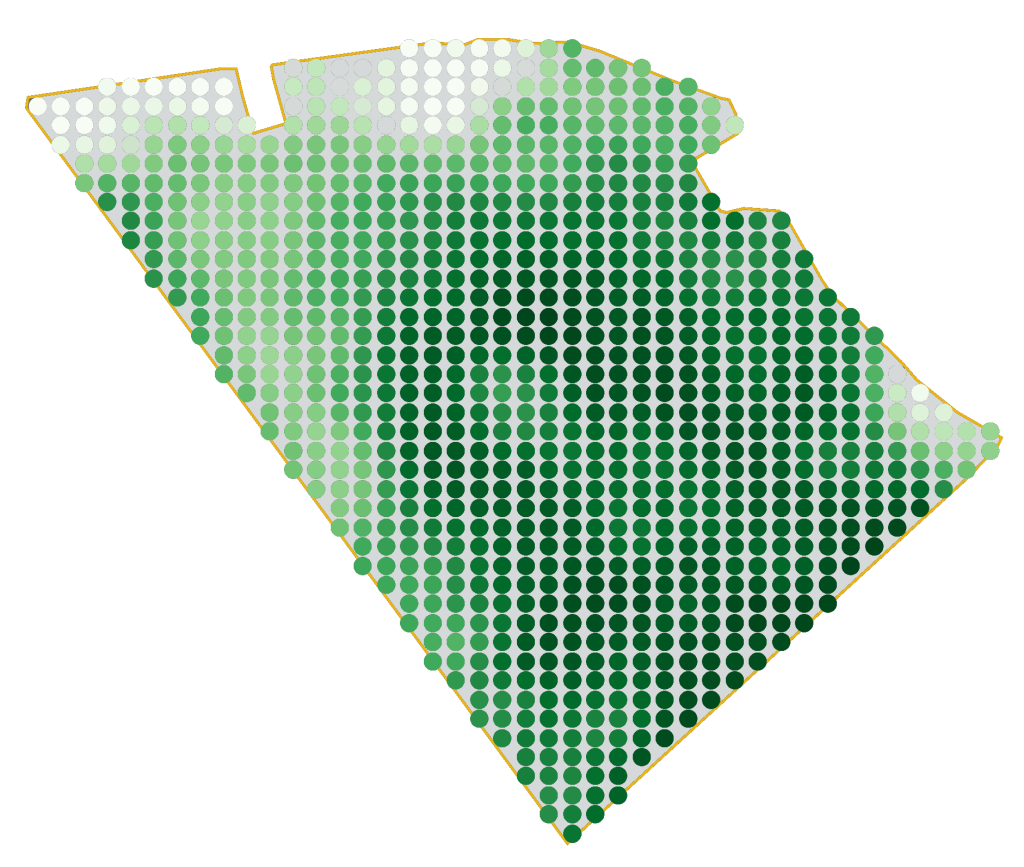
To give you an idea of how the biomass can vary across a field, let’s consider the satellite image taken in late June for a field in Sweden. The dark-shaded green areas represent parts of the field with a large NDVI value (that is, a dense crop with lots of biomass) and the light-shaded areas represent areas with low biomass. Sometimes people draw the conclusion that the light-shaded areas need more fertilization, but we argue that it is difficult to say that this is the limiting factor just because the NDVI index is low. It could be water stress or something else, and hence you always need to visit the field to determine what actions to take to improve the biomass and yield potential.
Data on diseases and weeds
Besides measuring the biomass, other things such as diseases and weeds that compete with the crop are valuable to measure and keep track of. Measuring different diseases are done in a similar way as for measuring biomass, that is using multi-spectral cameras and different indices that can relate to a stressed crop or a certain disease. It’s becoming more common to analyze data from multi-spectral images using machine learning methods to look for the “fingerprints” of diseases and other stresses in the data. Once they have learned how a disease or stress looks like in the data, it can search for these in new images taken with a similar camera. If you have the correct type of camera mounted to your drone or sprayer, it is possible to do a mapping of the field and then do site-specific treatment using the map or in real-time using the cameras on the sprayer (so called spot-spraying).
Similarly, a common RGB camera mounted on a drone, sprayer, or row hoe can be used together with machine learning algorithms to detect weeds in the images. This opens up for determining if there are weeds in the field, what type of weeds there are, how much of it and then create a map that can be used for planning and analysis of actions and inputs. Saving inputs on weed treatment means saving money while reducing the use of herbicides.
Agtechers' Actions
When measuring data related to the crop using for sensors on for example satellites or machines, you only measure one or a few parameters of the crop condition. Hence, always visit the field at interesting spots to relate the data to real-world observations!
In the next Agtech Letter we will learn more about data related to the yield.