
Data related to the soil are important to collect
One of the foundations in data-driven and efficient farming is to collect data about the soil. The soil and its properties set a limit in the crop farming and possible yields, and by understanding them you can plan your actions and inputs to match the need of the crop given the conditions in that specific field or management zone. In this Agtech Letter we provide you with some examples of data about the soil.
How to collect data about the soil
In this Agtech Letter we describe some of the different types of data that are available for understanding your fields and soils better. This data is important for several different decisions and processes in crop farming since the soil ability to store water, minerals, nutrients, micro organisms, organic matter, and much more will determine the growing conditions and potential yields of your fields.
Some of the most common types of data related to the soil can be collected using some kind of soil sampling technique, where soil samples are collected at different positions on the field and then sent to a laboratory that is specialized in soil sample analysis. Other types of data are collected using sensors on air planes, satellites, or drones which enables a quick and efficient scanning of large areas, where each type of collection method comes with both pros and cons. For example, the soil sampling gives a quite low resolution in space and is expensive but in turn the analysis results are quite good and done in a laboratory. In contrast to this, the scanning using satellite, air planes or drones, is much cheaper since larger areas can be scanned quickly and often have a higher resolution in space but comes at the cost that the measurements are often not as accurate as the laboratory analysis., nor is it properly calibrated to your specific field.
It has also become more common to have machine-mounted sensors that measure different properties such as soil moisture, and the development of these solutions are very interesting to follow since they provide data with high resolution in both space and time, and can be used for real-time control of the machine settings.
Here, we will give you some examples of data and outline how they are collected and why they are important. In future Agtech Letters and Agtech Deep Dives we will look more in detail on these types of data.
Mapping of soil texture and soil types
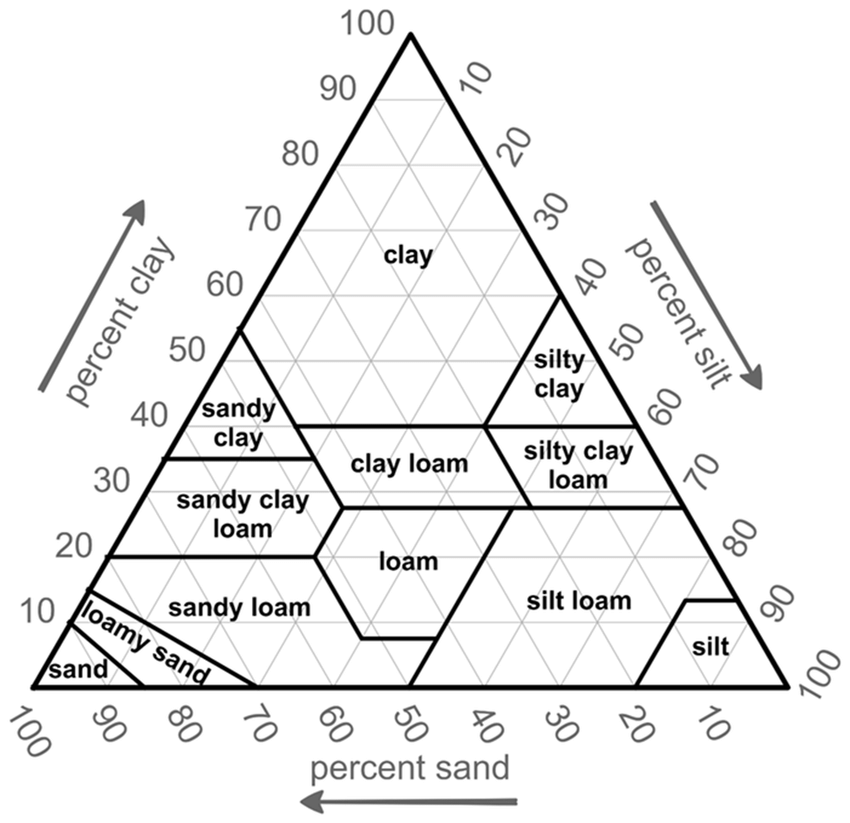
Soils consists of a combination of particles of different sizes that are describe by different fractions such as clay, silt, and sand. The amount of particles from each fraction in the soil will determine many of its properties, and hence it is interesting to measure and classify the soils based on how much of each fraction it contains. There exists different systems for defining the fractions and the classifications, but they are fairly similar in the definition of clay, silt and sand. By measuring how much of each fraction that is in the soil, it is possible to classify the soil as for example using the USDA soil triangle seen below, where the soil can be classified into 12 different categories.
A common way to map the soil types is to collect soil samples that are sent to a laboratory for measuring the clay, silt, and sand content. When mapping soil types, quite few samples are usually collected since to keep costs down, and hence other ways to measure soil types have been developed that are based on far-field sensing. One such example used in Sweden is the mapping of soil types that has been done by the Swedish University of Agricultural Sciences together with the Geological Survey of Sweden. In this mapping, scannings of gamma radiation from the soil has been measured using a sensor aboard an air plane that has scanned all of Sweden, and then these scans have been calibrated using a database of manually collected and analyzed soil samples. By combining the scans and the soil samples using a mathematical model, it is possible to estimate the soil content of clay, silt, and sand with a higher resolution in space than traditional soil sampling.
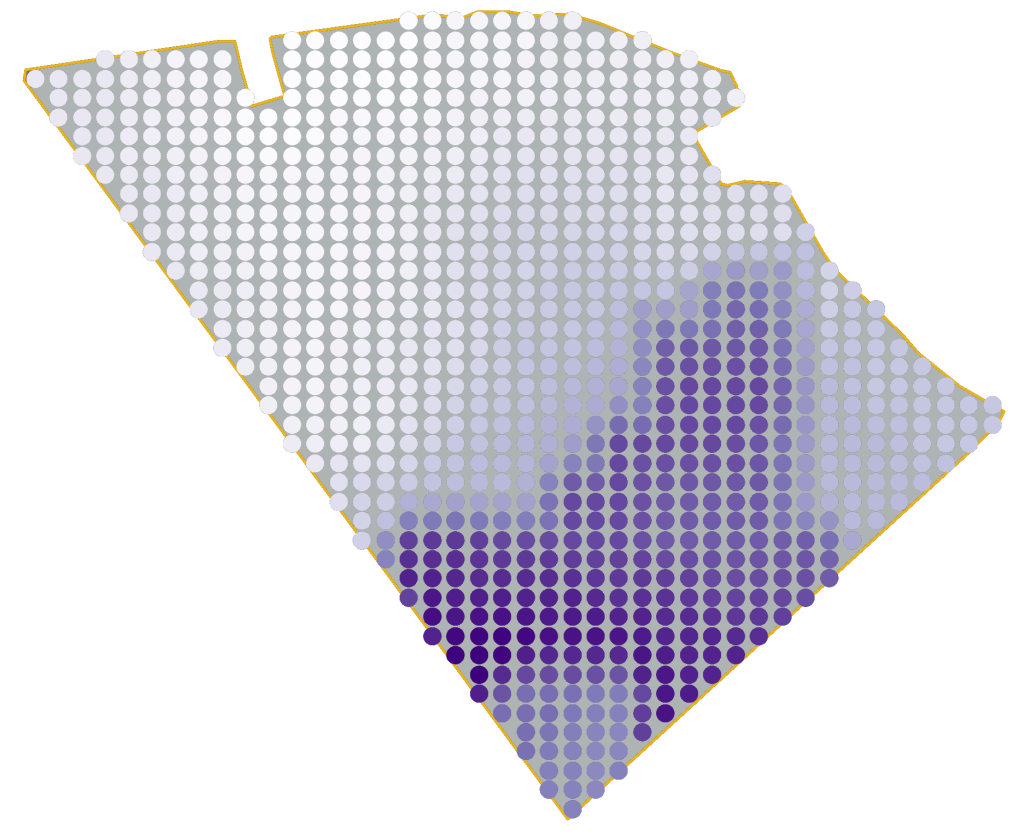
In the picture to the right, an example of this mapping of clay content is seen for a field in Sweden. The resolution of the mapping is about 50 x 50 meters and the dark-shaded purple areas in the field have a larger clay content (about 30%) than the light-shaded areas.
Farmers who use this mapping say that it seems to provide a good overview of the in-field variation of for example clay content, but sometimes it seems that the clay content might not be correct for all fields. This is nothing strange but rather one of the prices you pay for using a far-field mapping, and its always a good practice for you as a farmer to calibrate far-field mappings using in-field measurements.
Mapping of nutrients and pH levels
Another classic example of collecting soil data is to determine the amount of nutrients and pH levels in the soil. These are important for planning and follow up on actions such as limestone treatments, fertilization, and spreading of manure. It is also a very important information to determine what is limiting yields in different parts of the field. A classical model to describe and analyze the limiting factor for yield is the so-called Liebig’s barrel.
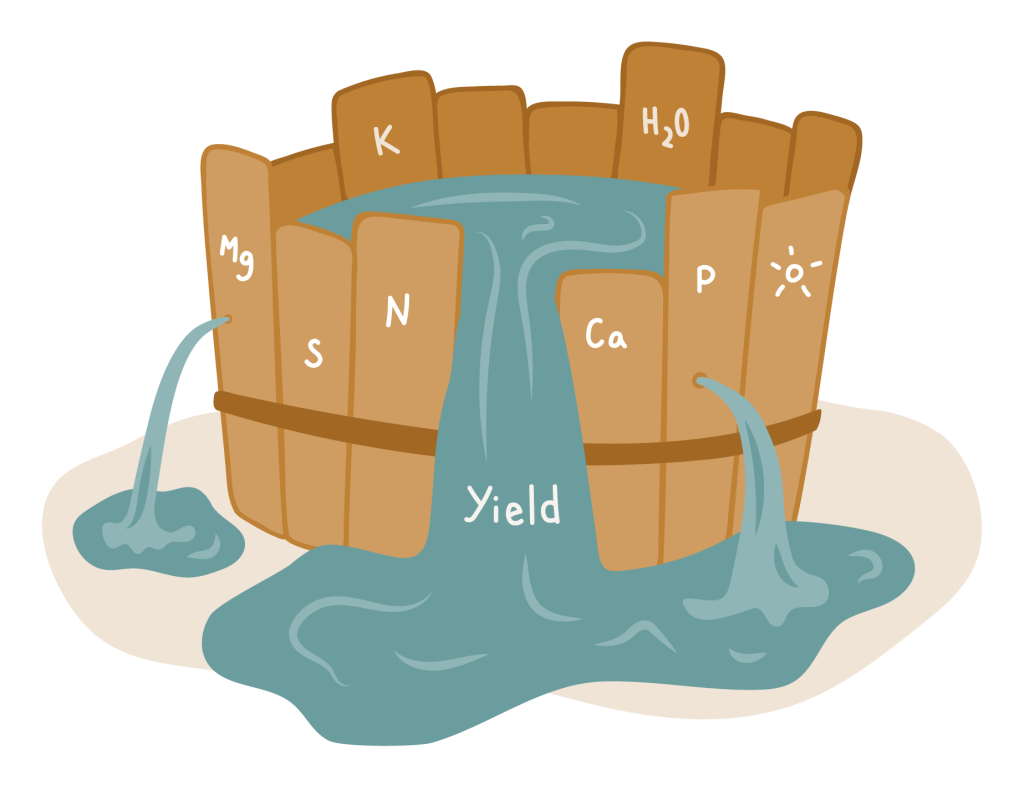
The idea behind this model is that fore every spot in the field there is at every instance in time one factor that is limiting the crop and its yield potential. The limiting factor can vary across the field at any given time, and for a single position in the field it can vary over time. Common factors that are limiting the crop development and yield potential are available water, macro nutrients such as nitrogen or phosphorous, and micro nutrients such as calcium, magnesium, or sulfur.
To better understand the limiting factor across the field, it is very helpful to measure the nutrient content in the soil together with the pH levels since it affects many of the biological processes in the soil.
One common way to measure the nutrient levels is once again to perform a mapping based on soil samples, where the samples are collected in a grid with 100 meters between samples (that is, one sample per hectare is collected in average). There are also other strategies for soil sampling, where the sampels can be more dense in areas with large differences and more sparse in parts of the field where the conditions are more stable. At each sample point, multiple soil samples are collected and mixed and then sent to the laboratory for analysis. Depending on what types of analyses you pay for, different parameters such as pH and plant-available phosphorous are measured.
Since the soil sampling is quite expensive and provide a mapping with low resolution in space, many companies and scientists are developing methods for measuring nutrient content in the soil using different far-field sensors such as multispectral images from drones or satellites, or hand-held sensors that are put into the ground to measure. This is a development that is promising and worthwhile to follow.
The process to create a nutrient mapping of a field
Here we will walk you through an example to showcase the major steps that are done to collect, process and visualize soil data for the plant-available phosphorous content in the soil for a field.
Collect soil samples
The first step is to physically collect the soil samples on multiple positions in the field. Choose either the traditional grid sampling or a more tailored sampling strategy for your field and needs.
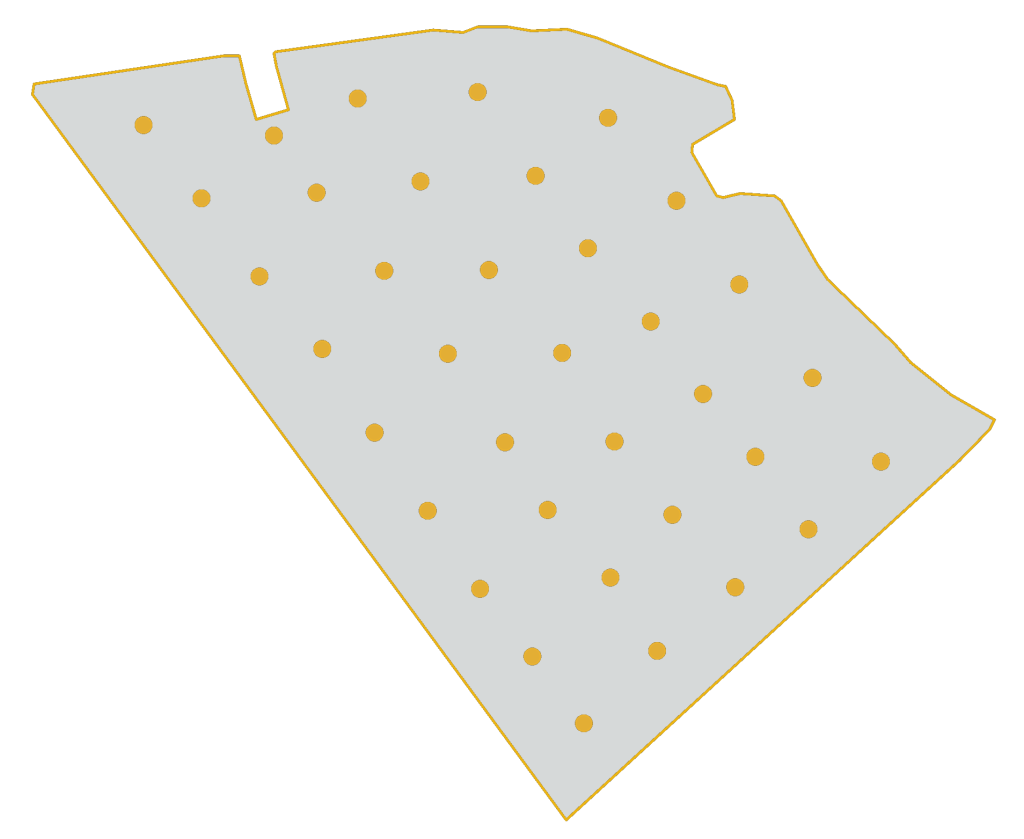
At each sample position, multiple soil cores are drilled and mixed to reduce the influence of a bad sample.
An example of a traditional grid sampling strategy with 100 meters between samples are provided to the right.
Send the samples to a laboratory
Once the soil samples are collected, they are tagged with the GPS position and then shipped to the laboratory for analysis. It’s very common to hire an agronomist service or similar to do the collection, tagging, shipping of the soil samples, and get the results. But you could do it by yourself if you want to. The analysis results are often returned in a regular text file (.txt) or Excel spreadsheet that can be read directly in your computer, but other file formats can also be available.
There exists many different service providers for soil sampling on the market today and they offer different services in terms of how the sampling is done and the results are returned and visualized. Find one that fits your needs and price level.
Import the data to a mapping software
The analysis results returned in text files or a spreadsheet do contain the data we are interested in, but it is not in a format that is easily digested for us. Hence, it is a good practice to use some kind of software to visualize the analysis results. Once again, there are many software services on the market and many of the farm management information systems can be used to visualize your soil sampling data.
Create the nutrient map using interpolation
Soil sample data can be visualized as a map covering the field, but since data is only available for the positions where the soil samples where taken (often one per hectare), the data need to be processed to create a map where also positions besides the sampling positions get an estimate of the nutrient level. This process to determine the values of positions between the sampling positions is called interpolation and is a widely used method for increasing the resolution in space for the data. Keep in mind though that it is only for the sampling positions that we can be certain about the measured value!
There exists many different interpolation methods, and one that is commonly used for soil sampling and creating soil maps is called Kriging. This method is specifically developed for geo spatial data, that is, data which is related to each other geographically such as samples across a field. There are examples of other interpolations methods such as the simple linear interpolation and methods using machine learning to determine the value between the sample positions. Which one to use is up to the service provider and user to choose.
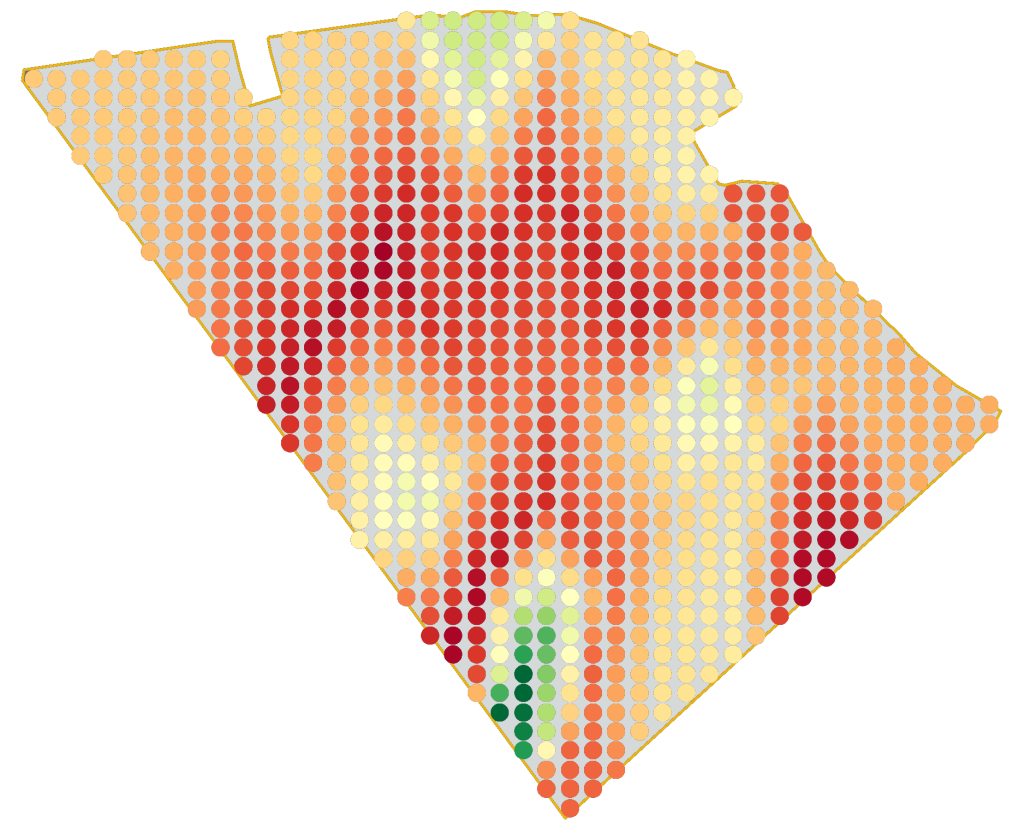
As a use of the maps for different soil properties such as phosphorous levels, it is important to always keep in mind that the map is tricking you into believe that there is more data available than what it actually is. Consider the images below, there the left one shows the sampling positions and the right one shows the phosphorous levels computed using interpolation. All points in the map that are not a sampling point will be an estimate (a qualified guess) that is often, but not always, quite close to the true value.
Understand data and its limitations
From both examples in this Agtech Letter (the clay map and the nutrient map) it is clear that you need to be cautious when analyzing and drawing conclusions based on data if you do not know and take into consideration how the data was collected and where it comes from. Let’s say that you only the the nutrient map and not the sample positions, then it is difficult to judge how much you can trust the map.
For the clay content map, it can be difficult to determine the real clay content exactly, but still the in-field variations can be determined in a more reliable way. If the variation is the most important information you want to know about, then the map can probably be used directly whereas if you need to know the exact value of the clay content a traditional soil sampling with focus on soil type might be more relevant.
For creating maps of nutrient content in the soil, the interpolation introduce uncertainty that you need to consider. When looking at a map that is nicely produced with high resolution in both space and the values, it is very easy to believe that there are much data collected from the field. However, due to the sparse sampling grid most data points in the map are qualified guesses and should be treated as such.
Agtechers' Actions
Collecting soil data is a valuable action to improve your knowledge and understanding of the soil properties and limiting factors of high yield. However, always keep in mind that the soil maps are not as detailed as they look like when presented as nice-looking maps.
In the next Agtech Letter we will learn more about data related to the crop itself.